Task 2 category performance analysis — 13 slides covering revenue drivers,
seasonal patterns, customer retention, promos, and delivery economics.
Slide deck
Browse the full presentation below — charts and narrative match the downloadable files.
- • 98,871 orders across 2,001 customers generate about €445,434 in basket revenue.
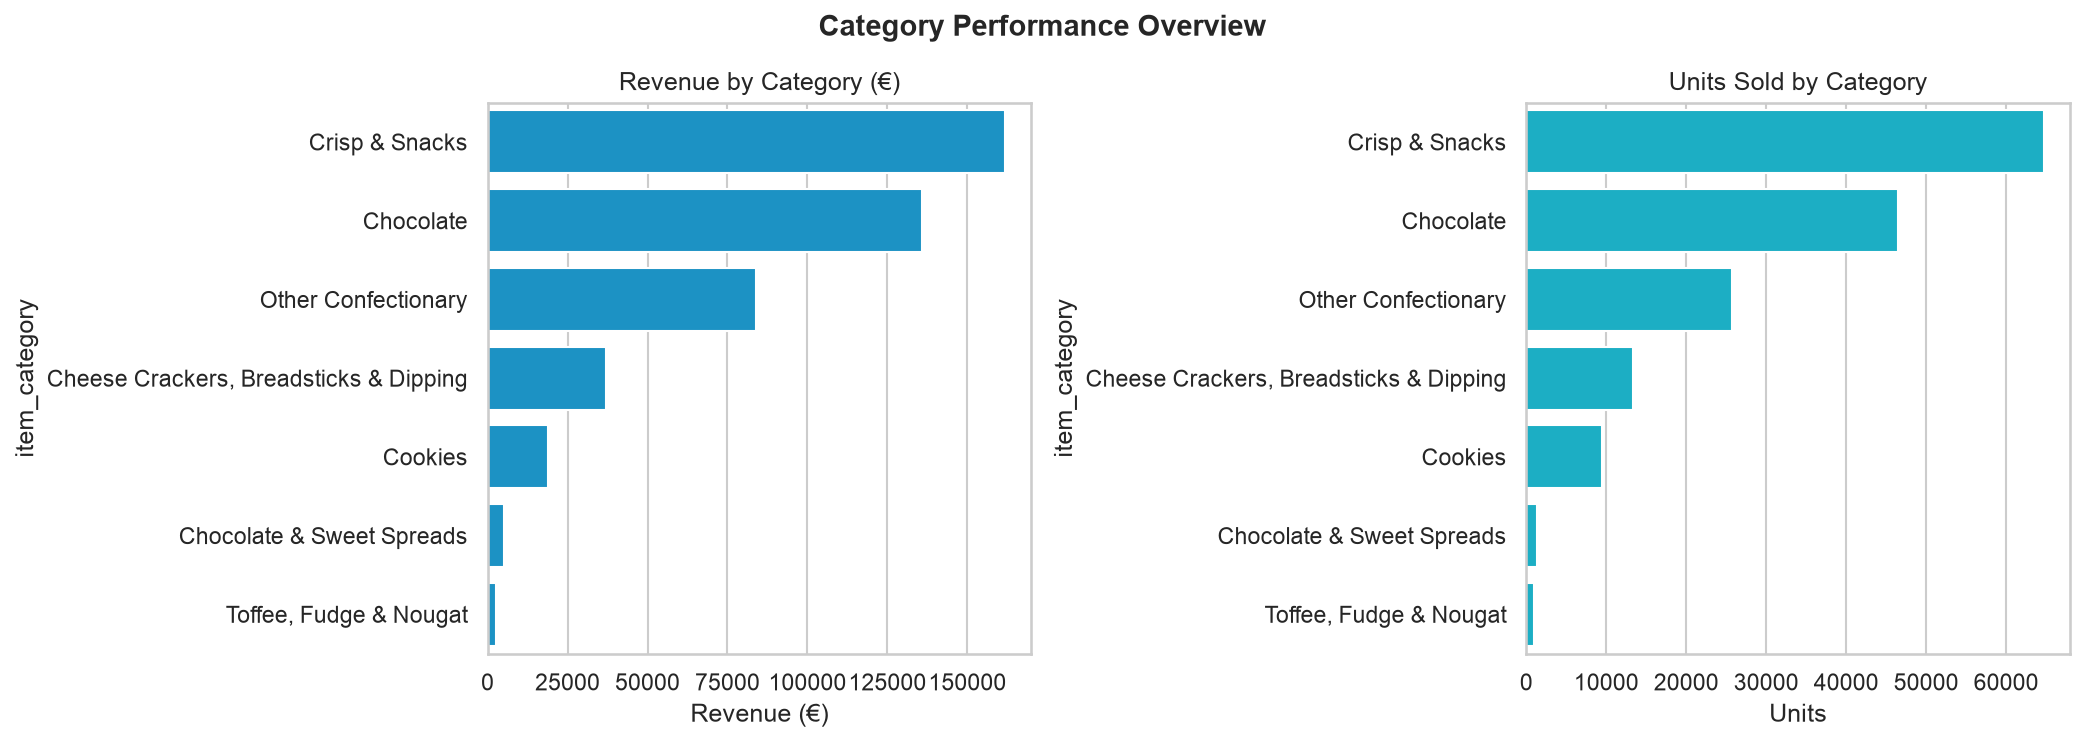
- • Top category by revenue: Crisp & Snacks.
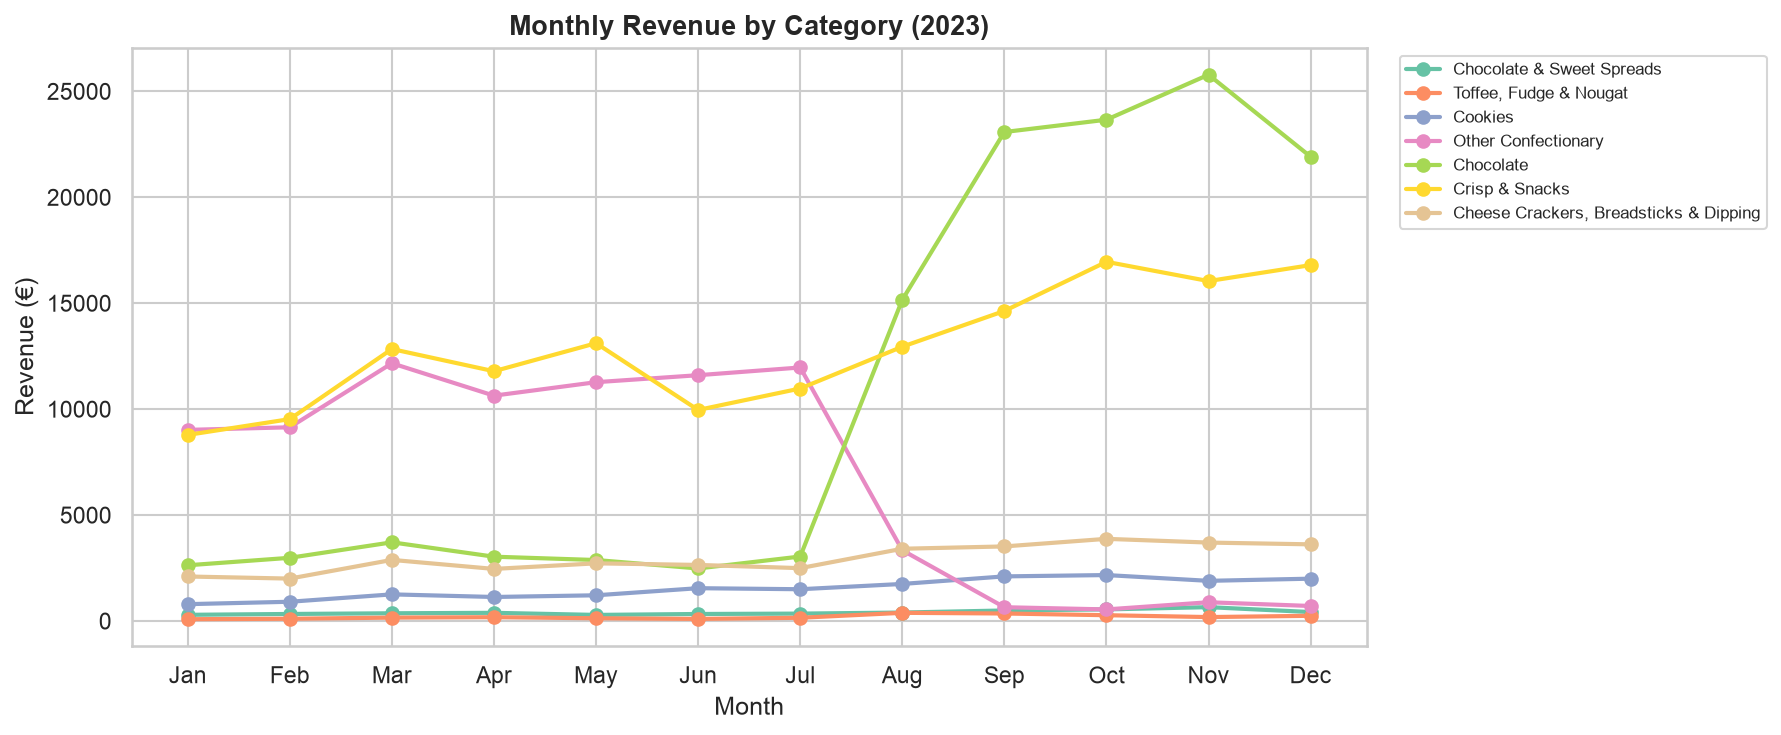
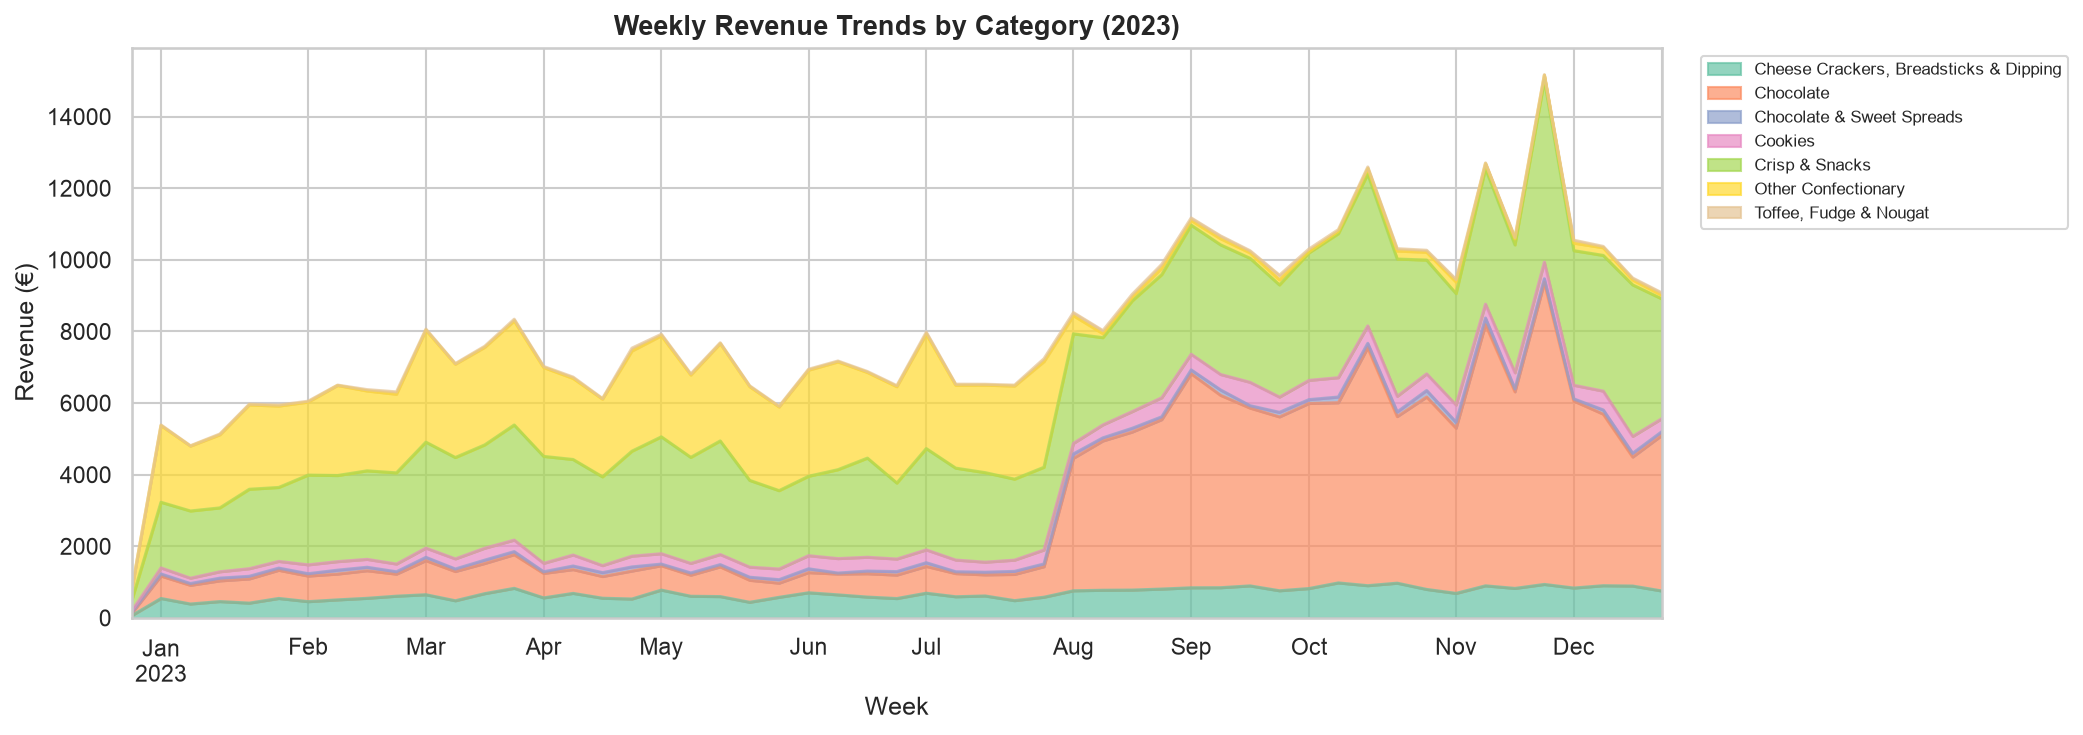
- • Chocolate accelerates strongly in late 2023, indicating seasonal demand.
- • Crisp & Snacks stays consistently strong; cross-category baskets suggest bundling potential.
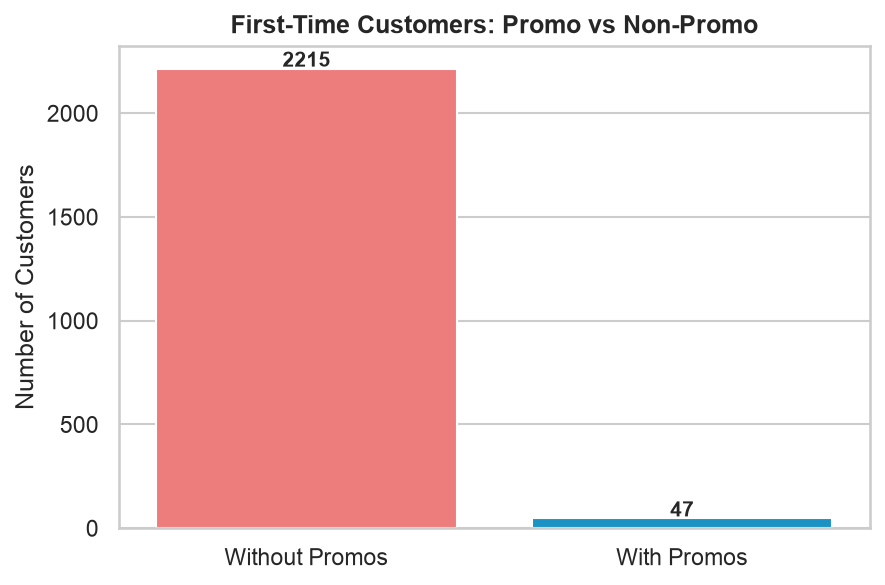
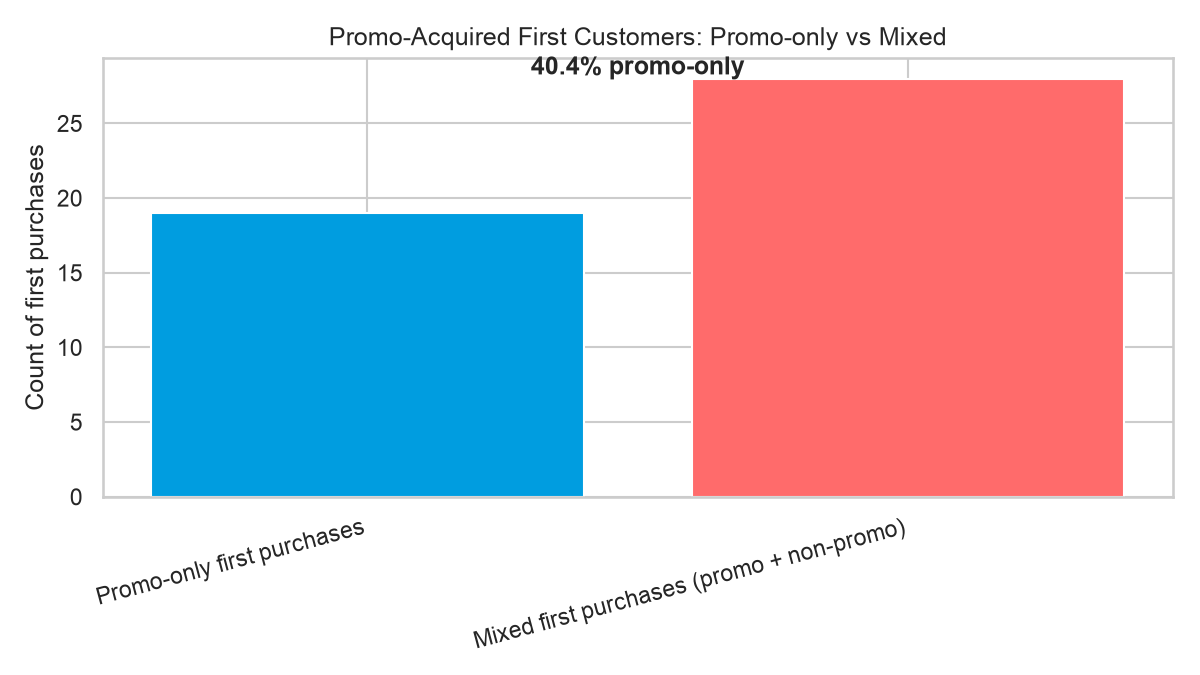
- • Promo-acquired first customers: 47 first purchases include promo items; 40.4% are promo-only.
- • Crisp & Snacks leads on both revenue and units.
- • Chocolate is the key growth driver in H2.
- • Smaller categories remain opportunities but may need assortment/promotion tuning.
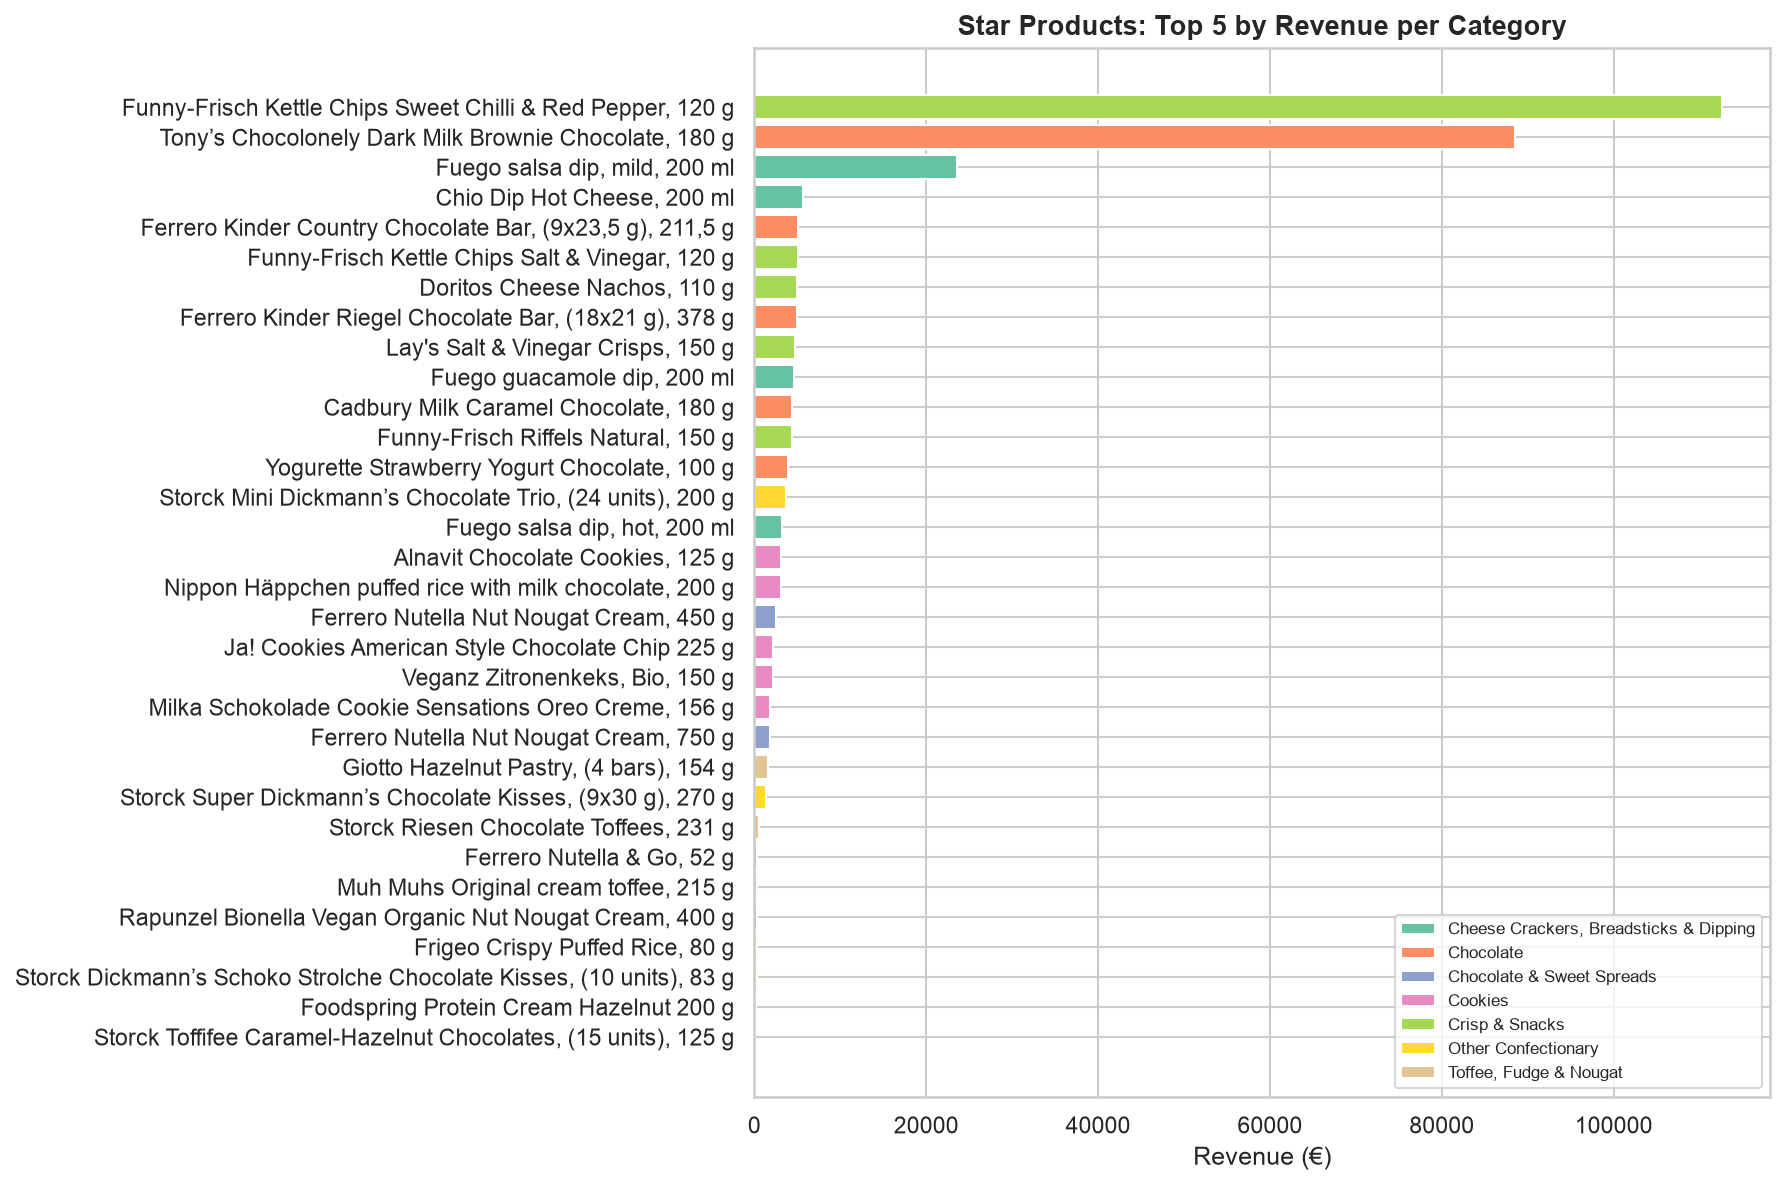
- • Within every category, a small set of items drives most revenue (Pareto-style concentration).
- • Star products are the best candidates for targeted promotions and merchandising.
- • Chocolate shows pronounced growth from around August onwards.
- • Several smaller confectionary categories shift sharply across mid-year (possible catalog/promo changes).
- • Underperformers identified by comparing H1 vs H2 2023 revenue by category.
- • Worst performer: Cookies (66.4% H2 vs H1).
- • Second worst: Toffee, Fudge & Nougat (109.2% H2 vs H1).
- • Next step: verify whether the decline aligns with fewer promos, weaker star products, or assortment changes.
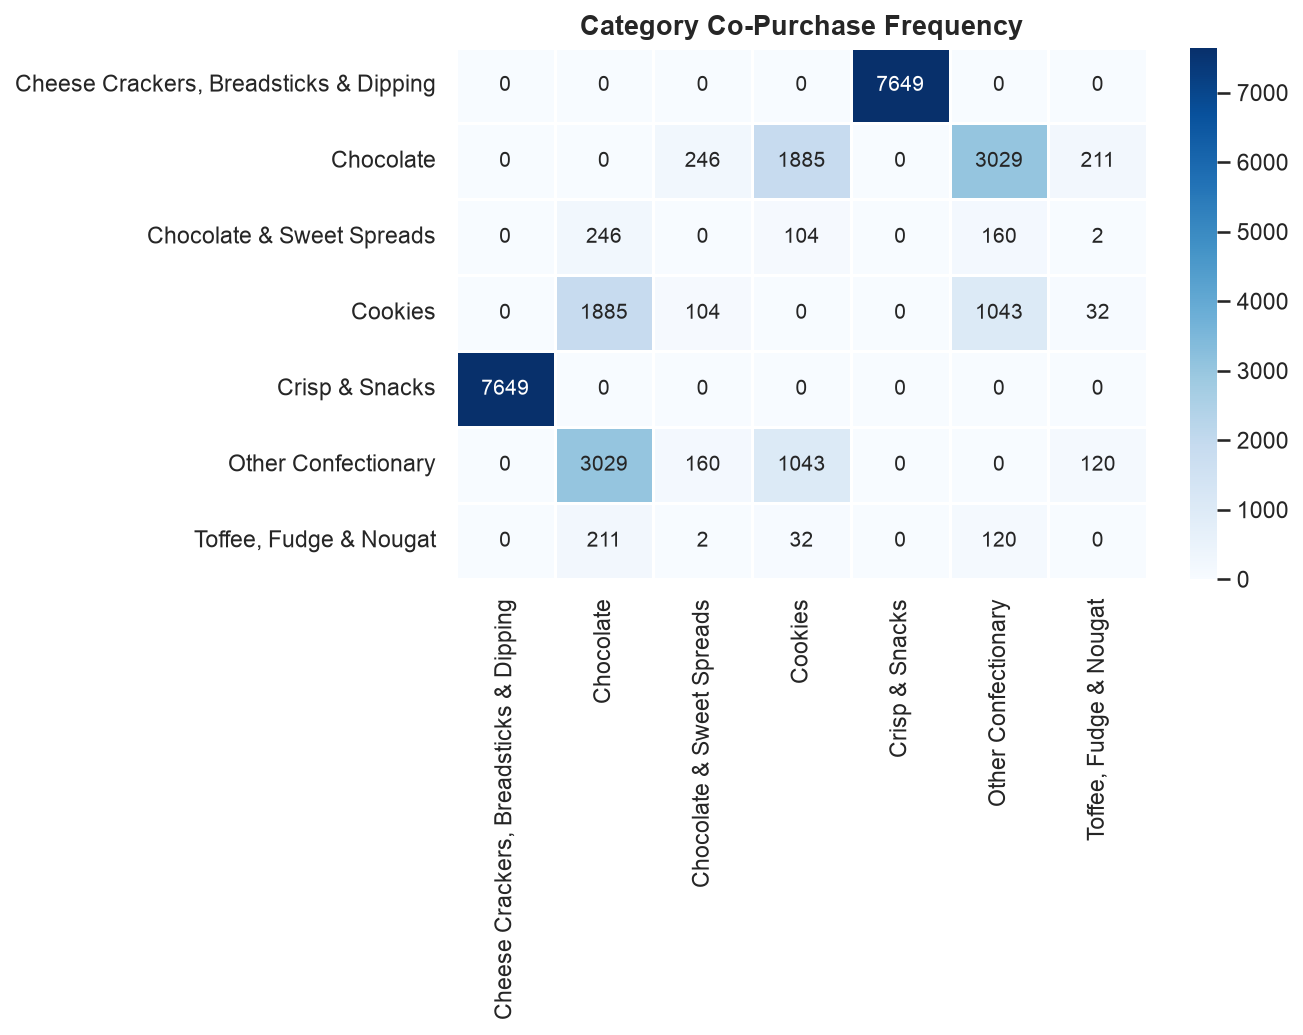
- • Orders often include a single category, but meaningful cross-category co-purchases exist.
- • Promoting the most common co-occurrence pairs could increase basket size.
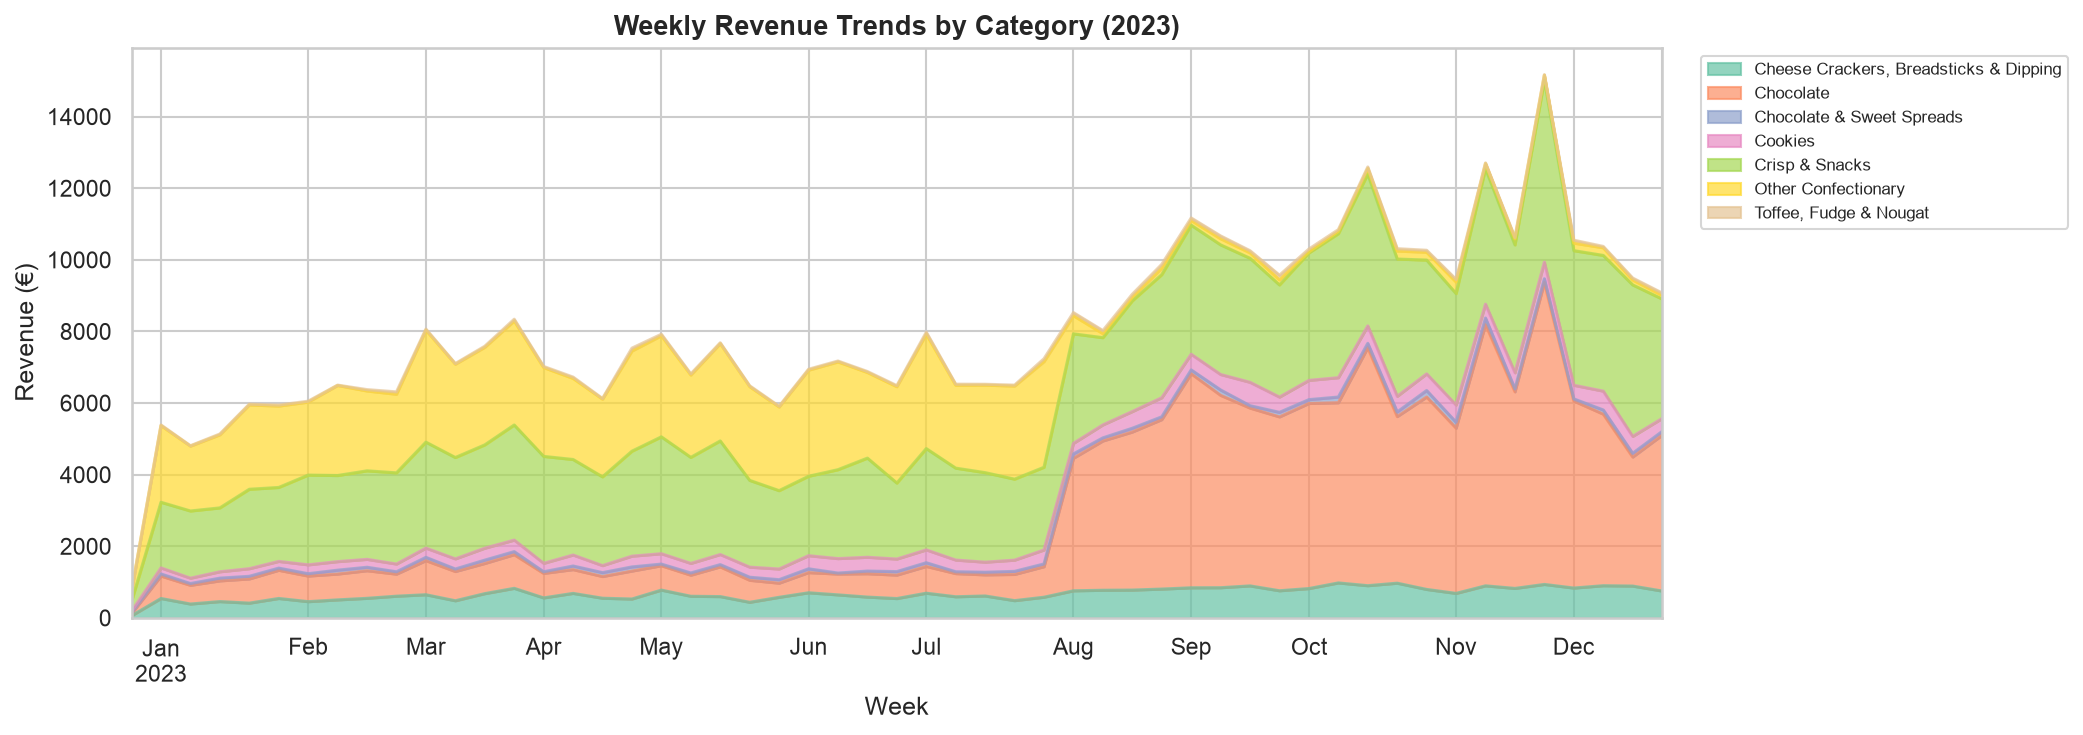
- • Weekly revenue curves highlight when each category ramps up or fades.
- • Use these trends to time promotions and to anticipate shifts in demand.
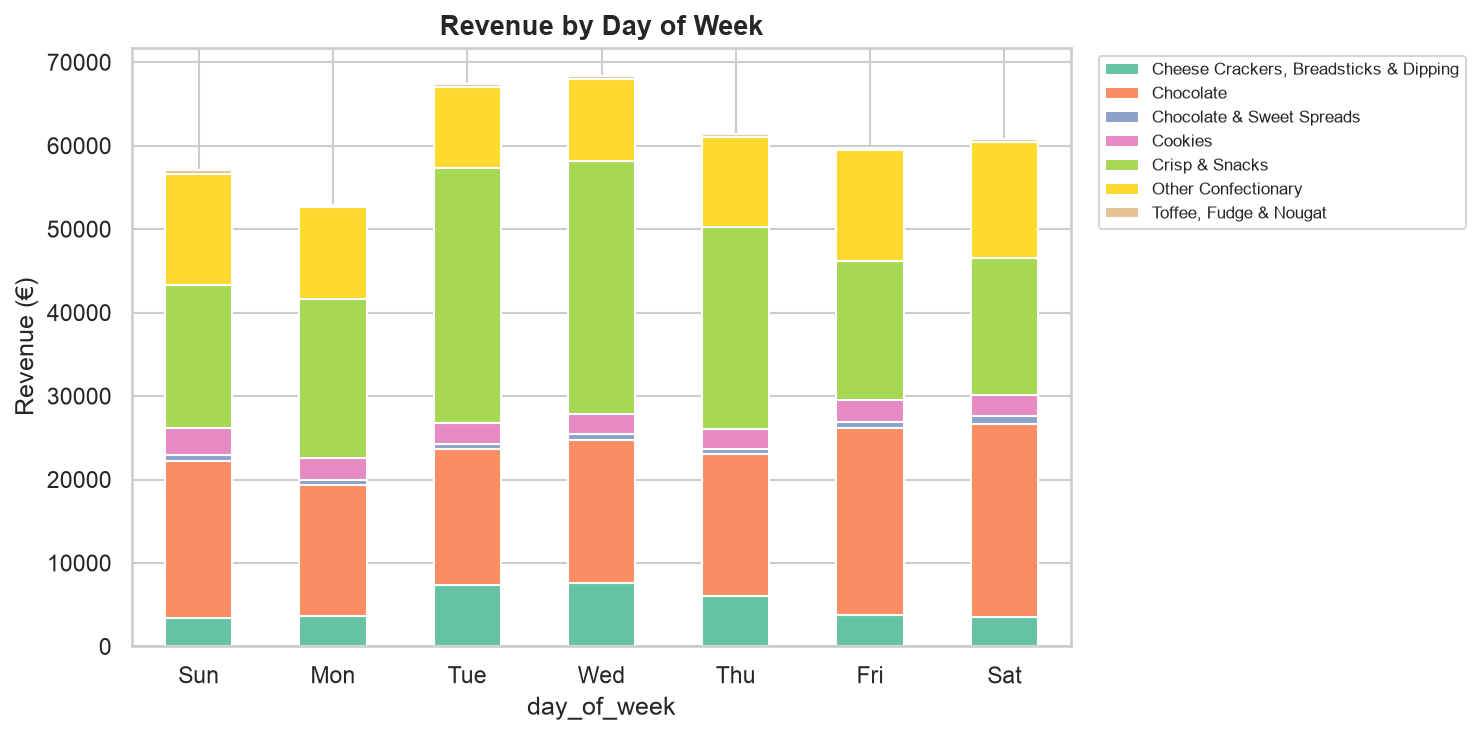
- • Day-of-week patterns are visible when revenue is stacked by category.
- • This can support promo scheduling and courier capacity planning.
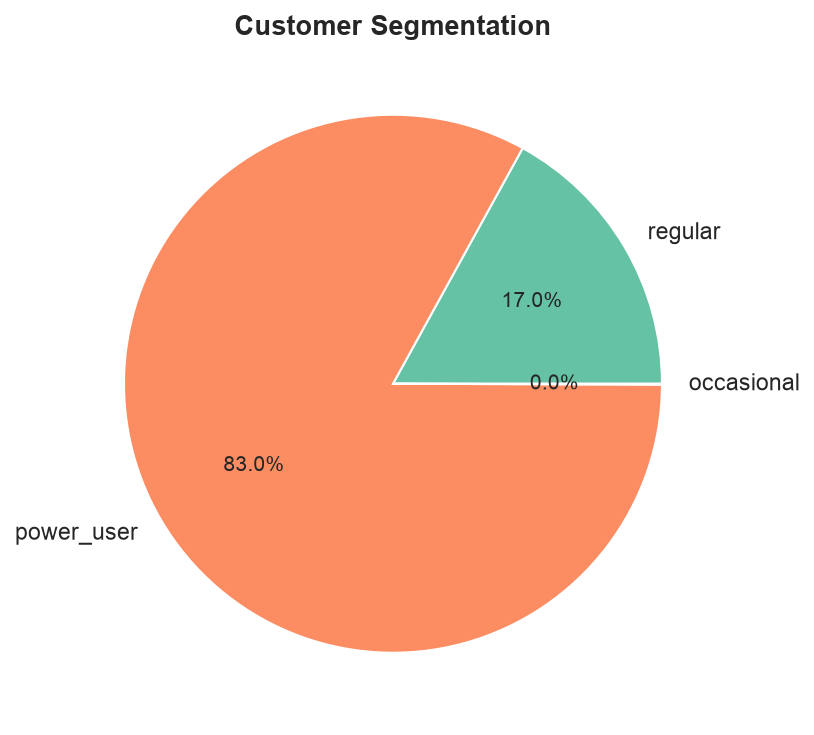
- • Segments based on purchase frequency show where revenue concentration lives.
- • Retention is essential: repeat customers are disproportionately valuable.
- • Promos contribute first-time customers, but not all first-time orders include promo items.
- • Key question: do promo-acquired customers buy only discounted items?
- • Among first purchases that included promos: 19/47 are promo-only.
- • That equals 40.4% promo-only first purchases.
- • Implication: promos likely attract customers who are price-sensitive; conversion to non-promo demand should be tracked.
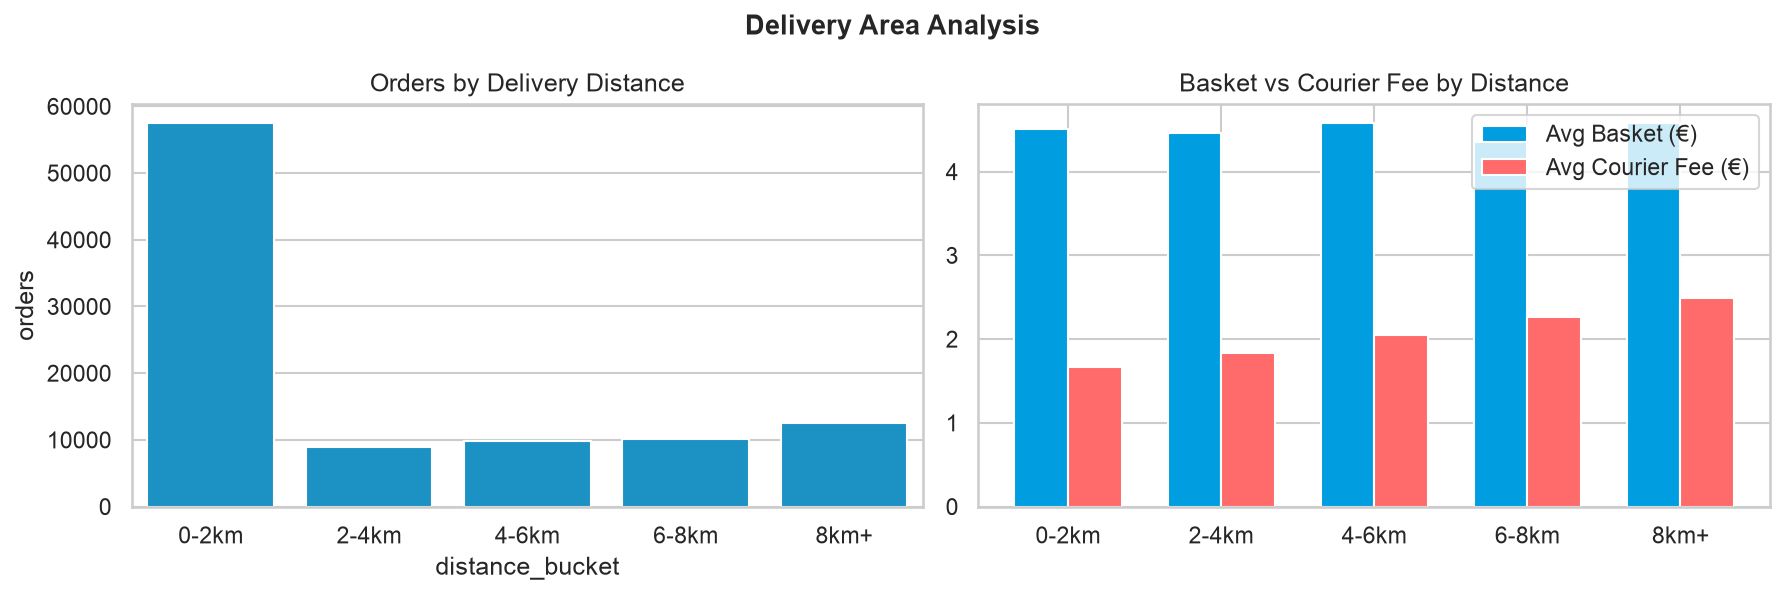
- • Fee-to-basket ratio varies by distance bucket.
- • Courier and Wolt service fees materially affect the customer spend experience for small baskets.
- • Task 1: dbt + star schema + SCD Type 2 for item attributes at time of purchase.
- • Task 2: metrics computed from mart tables; charts exported for business-friendly review.
- • Data quality: duplicate item log rows were deduplicated; missing price values were imputed using last-known value.
- • Deliverables: final datasets in `output/` + metrics CSVs used for charts.